Issue
Tracker
Transforming a fragmented, manual audit ecosystem into a single, intelligent collaboration layer - built for global teams, engineered around human behavior.
Transforming a fragmented, manual audit ecosystem into a single, intelligent collaboration layer - built for global teams, engineered around human behavior.
01 - Context & Objectives
In the high-stakes world of global financial auditing, the gap between the core audit platform and the Client Portal was costing the firm dearly : in time, trust, and transparency. The Issue Tracker was commissioned to close that gap, decisively.
The product needed to centralize every audit-related issue into a single, structured, accountable environment. We were not just designing a feature, we were redesigning the professional DNA of how an audit engagement is conducted.
02 - The Problem to Solve
Before this project, audit teams and clients operated through a patchwork of disconnected tools. Issues lived in email threads, resolution status in spreadsheets, and sensitive documents in shared drives with inadequate access controls.
Our discovery phase revealed that this wasn't just a UX inconvenience, it was a systemic risk. Documentation gaps created compliance exposure. Manual summarisation introduced error. Informal delegation left no audit trail. The "So What?" was stark: without intervention, the firm faced not just delays, but potential regulatory and reputational fallout.
"Audit teams and clients are currently unable to achieve seamless collaboration due to ineffective communication channels, a lack of integrated tools, and an opaque issue tracking system - hampering transparency and operational efficiency across the entire engagement lifecycle."
03 - My Role & Collaboration
I owned the complete UX trajectory, from aligning stakeholders on business vision through discovery, ideation, and iterative validation. My specific responsibilities spanned:
04 - Discovery & Research
Designing for a global platform demands a departure from one-size-fits-all thinking. We operationalised insights from EMEIA, APAC, and the Americas to understand the specific artifacts already in use and mitigate the risk of a fragmented global rollout.
We employed 1:1 moderated sessions to capture qualitative nuances, while the System Usability Scale (SUS) provided the quantitative baseline required to measure the ROI of our design interventions. Regional analysis uncovered stark divergences, from EMEIA's colour-coded Excel spreadsheets to APAC's Gantt-chart milestone timelines - each carrying distinct data models and mental frameworks.
05 - Prioritisation & Ideation
To transition from qualitative research to a validated feature roadmap, I deployed a prioritisation strategy that balanced urgent user needs with long-term business goals, ensuring no feature entered the product without a direct pain-point justification.
Every feature in the final product was a direct response to a validated pain point. The decision logic followed a strict convergence path, user desire plus business goal equalled prioritised feature.
06 - Design Evolution
Our iterative design process was governed by this single mantra. We focused on creating heuristic designs patterns aligned with natural human behaviour to boost product adoption and reduce training time.
Each iteration phase was validated through the SUS framework, with qualitative feedback from moderated sessions layered onto quantitative scores. Designs that failed the human behaviour test, regardless of their aesthetic merit, were discarded in favour of approaches with superior task completion rates.
The initial concept presented all issues in a flat, editable list view, similar to a spreadsheet. Users could edit fields inline without opening a detail panel. Testing revealed this created severe "information clutter": auditors struggled to distinguish issue severity at a glance, and concurrent editing by multiple users led to data conflicts. The lack of contextual hierarchy meant critical issues received no more visual weight than low-priority items. This concept was discarded after round one testing.
We pivoted to a Kanban board model, grouping issues by status in swimlane columns. This improved visual hierarchy significantly and resonated with APAC participants familiar with milestone-based workflows. However, filtering across large issue volumes became cumbersome, scrolling horizontally across columns was disorienting, and the absence of tabular density made it difficult to manage 50+ active issues simultaneously. SUS scores improved but remained below our target threshold. Retained as an optional view mode but not the primary interface.
The validated solution combined a structured, filterable table view as the primary surface with a sliding contextual detail panel that maintained context without navigating away. Colour-coded criticality badges provided immediate visual triage, whilst standardised metadata columns enabled powerful cross-engagement filtering. Secure reporting views with configurable data masking addressed the confidentiality constraint directly. This direction achieved the highest SUS scores and was carried forward to build.
07 - The Proposed Solution
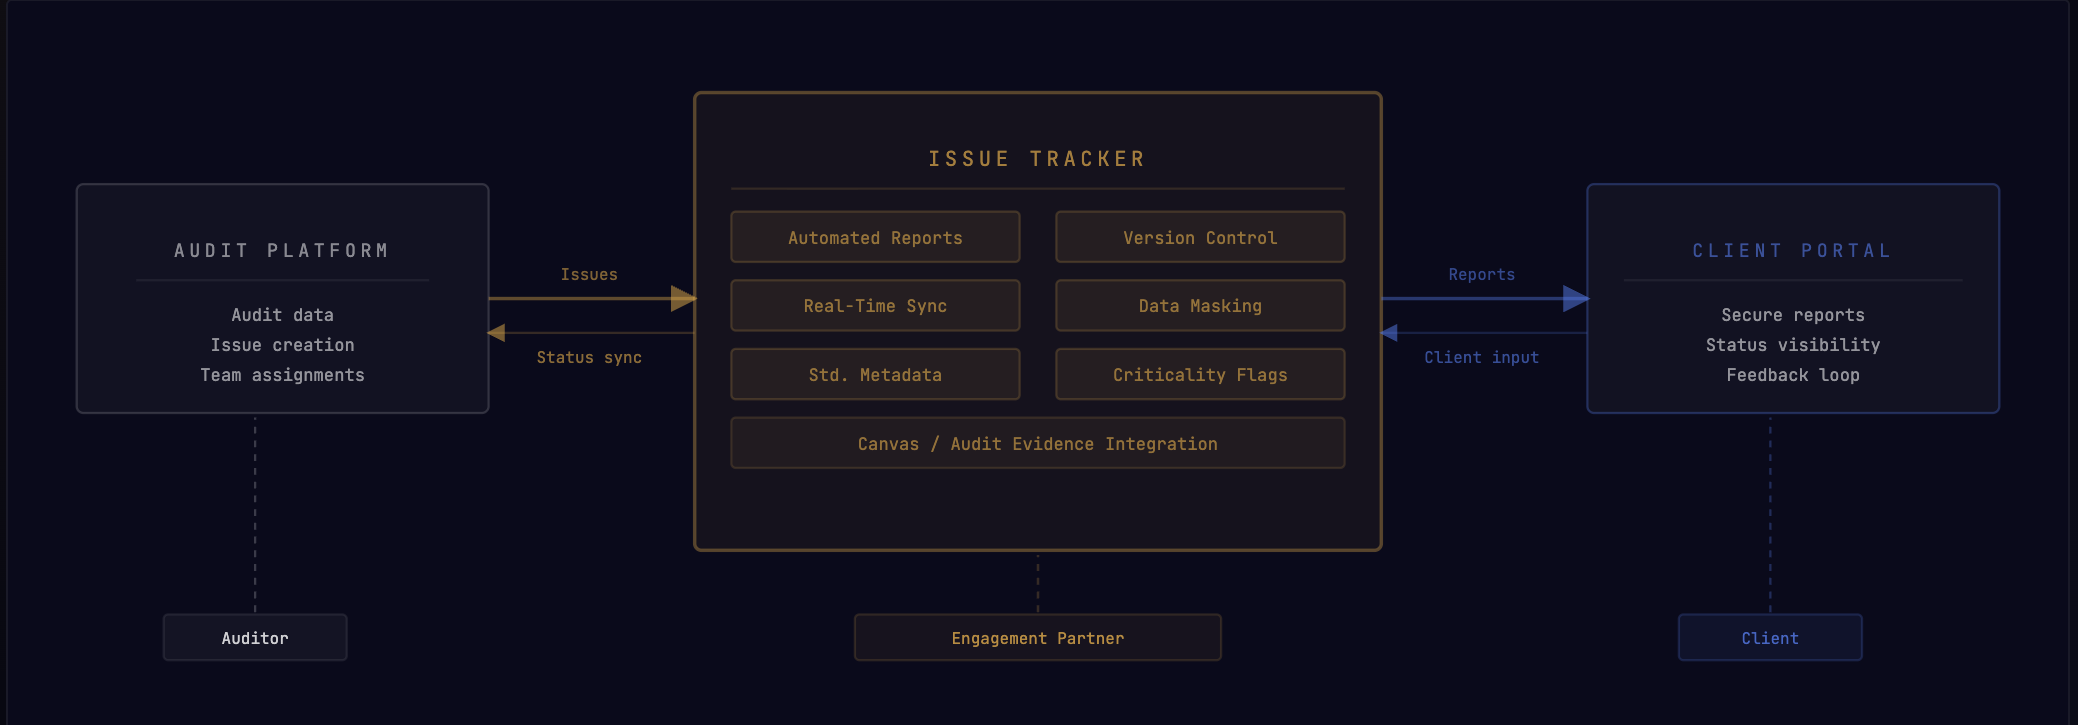
The final Issue Tracker functions as a strategic addition to the Client Portal, transforming a manual, high-friction process into a professionalised, automated ecosystem with four core differentiators.
The solution was engineered to provide the professional audit experience required to differentiate the firm as a trusted partner - moving from reactive issue management to proactive, transparent engagement delivery. Each differentiator was validated against a specific pain point identified during discovery.
08 - Challenges & Constraints
Developing a global tool within a regulated financial environment meant operating with constraints that couldn't be designed around - only designed through.
Every project of this complexity involves design concepts that looked promising on a whiteboard but failed in testing or against constraints. Being transparent about what didn't work is as important as showcasing what did.
The first iteration : a flat spreadsheet-like list with inline editing was discarded after round one testing. While it matched users' existing Excel mental model, it created information overload and offered no visual hierarchy for issue severity. Users completed triage tasks 40% slower than with the final direction.
The Kanban model dramatically improved visual hierarchy and resonated with APAC participants. However, it broke down at scale - managing 50+ active issues across swimlane columns was disorienting and increased cognitive load. It was retained as an optional view mode but removed as the default interface.
The sensitivity of audit data required significant design capital invested into "masking" protocols, configurable controls that allow professional reports to be shared externally without exposing entity-specific information. Balancing security with usability without adding friction was the central design tension throughout.
Pre-planning resource constraints required careful orchestration to ensure the design team could meet varied regional requirements simultaneously. We mitigated this through phased discovery, running EMEIA and Americas research in parallel before APAC, and by building region-specific artifacts for each stakeholder group.
Multiple early prototypes led to "information clutter" when displaying issue comment threads alongside resolution history and version logs. The solution : a tabbed detail panel that separated communication from documentation - emerged only after four iterations of layout testing and two rounds of SUS validation.
The most critical structural challenge: EMEIA, APAC, and Americas each had different core data fields, terminology, and status taxonomies. Mapping these into a unified schema without losing regional nuance required three rounds of cross-regional workshops and a hybrid metadata model that maintained local flexibility within a global structure.
09 - Impact & Outcomes
Implementation of the Issue Tracker fundamentally shifted the firm's audit delivery model, from manual work plans to a high-speed, automated engagement experience. The impact was measurable across operational, relational, and institutional dimensions.
By evaluating the emotional aspects of the audit process and building products aligned with human behaviour, we achieved higher adoption rates and lower resistance to change. Auditors didn't need to be trained into new habits, the interface reflected the cognitive patterns they already had, reducing onboarding time significantly.
Professionalized, transparent tracking strengthened client relationships, reinforcing the firm's reputation for leveraging innovative technology to provide clarity and speed at every stage of the engagement lifecycle.
10 - Reflections & Learnings
The visual design and UX craft were, in many ways, the easier part. The harder and more valuable work was building and maintaining alignment across senior audit managers, engagement partners, sponsors, and product managers across three global regions. Without that alignment, no design survives implementation. I learned that a design lead's most critical output is often not a screen, it's a shared understanding of why the screen needs to exist in that exact form. Strategic alignment with partners and sponsors is the only way to ensure design objectives survive the realities of global rollout.
The most significant adoption lever wasn't a tutorial or onboarding flow, it was designing interfaces that matched the cognitive patterns users already had. When the interface behaved the way auditors expected, resistance to change evaporated. Global consistency in design patterns is the primary driver of adoption and error reduction at scale. Regional variations in UX are a liability, not a feature of cultural sensitivity. This project solidified my conviction that heuristic standardisation, not localisation is what unlocks global product success.
The decision to discard the flat list and Kanban concepts, despite investment in those directions was not comfortable. But the SUS data and qualitative feedback made the business case for those decisions unambiguous. "Unless you test, it's just a guess" became the mantra that gave us the confidence to discard work without sentiment and the credibility to justify those decisions to stakeholders. Continuous testing is not a phase in the process, it is the process. I will carry this as a foundational principle into every future engagement.